-
-
-
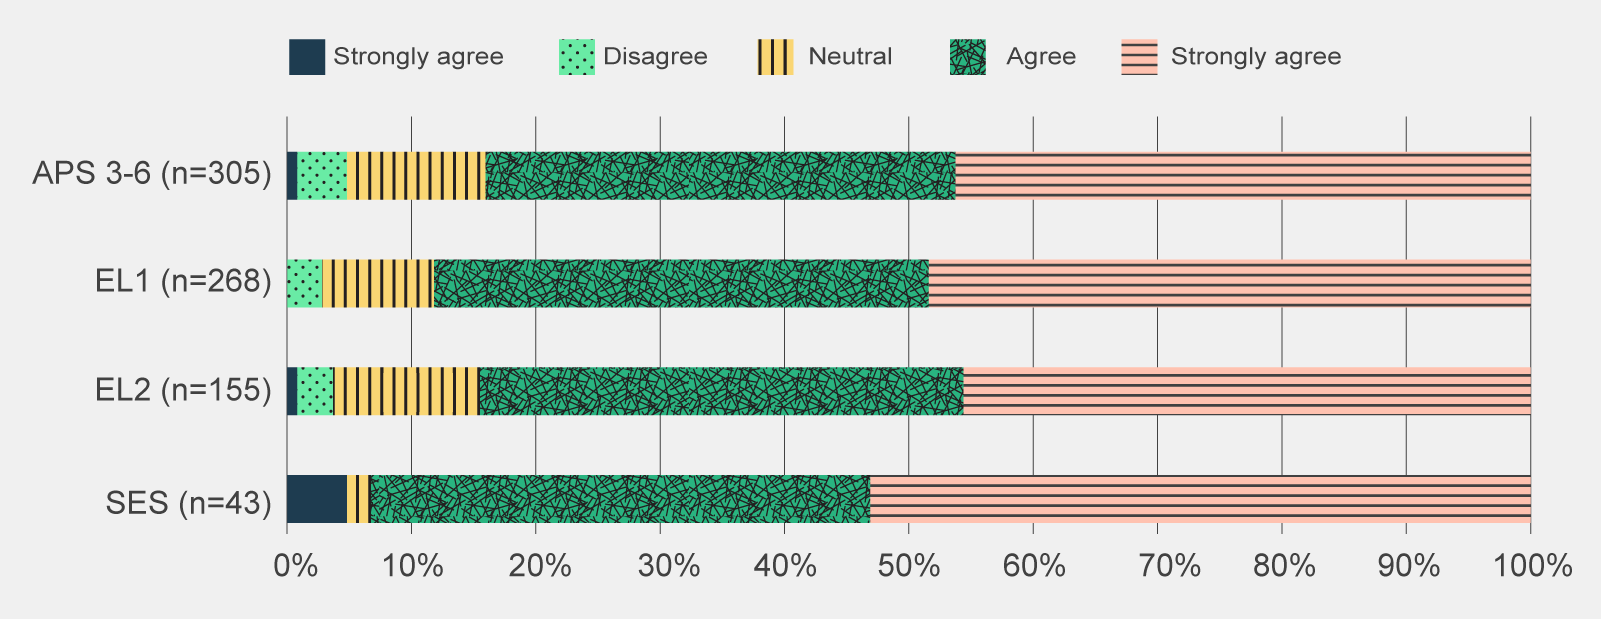
Figure 4 | Post-use survey responses to 'What extent do you agree with the following statement: I want to continue to use Copilot after the trial', by APS classification -
Data table for figure 3
Post-use survey responses to 'Which of the following best describes your sentiment about Copilot after having used it?', by APS classification.
Sentiment Very pessimistic Slightly pessimistic Neutral Slightly optimistic Very optimistic APS 3-6 (n=305) 1% 6% 20% 42% 31% EL1 (n=268) 1% 9% 10% 44% 35% EL2 (n=155)* 1% 6% 14% 45% 35% SES (n=43)* 2% 2% 2% 58% 35% *Margin of error at a 95% confidence level > 0.05. Totals may amount to less or more than 100% due to rounding.
Off -
-
-
Data table for figure 4
Post-use survey responses to 'Which of the following best describes your sentiment about Copilot after having used it?', by APS classification.
Sentiment Strongly disagree Disagree Neutral Agree Strongly agree APS 3-6 (n=305) 1% 4% 11% 38% 46% EL1 (n=268) 0% 3% 9% 40% 48% EL2 (n=155)* 1% 3% 12% 39% 46% SES (n=43)* 5% 0% 2% 40% 53% *Margin of error at a 95% confidence level > 0.05. Totals may amount to less or more than 100% due to rounding.
Off -
-
-
SES survey respondents in the post-use survey mainly referenced productivity benefits, both for themselves and their team. SES noted that Copilot appeared to be driving a reduction in time staff spent in creating briefing materials and lifted the general professionalism of written documents. On an individual level, it was seen as a tool for saving time through summarising meetings, email conversations and documents. SES survey respondents also viewed the trial as a positive step for the APS in embracing new technology.
Of the job families, trial participants in the Corporate grouping were particularly positive about Copilot with 86% of post-use survey respondents indicating they would like to continue to use Copilot after the trial as indicated in Figure 6.
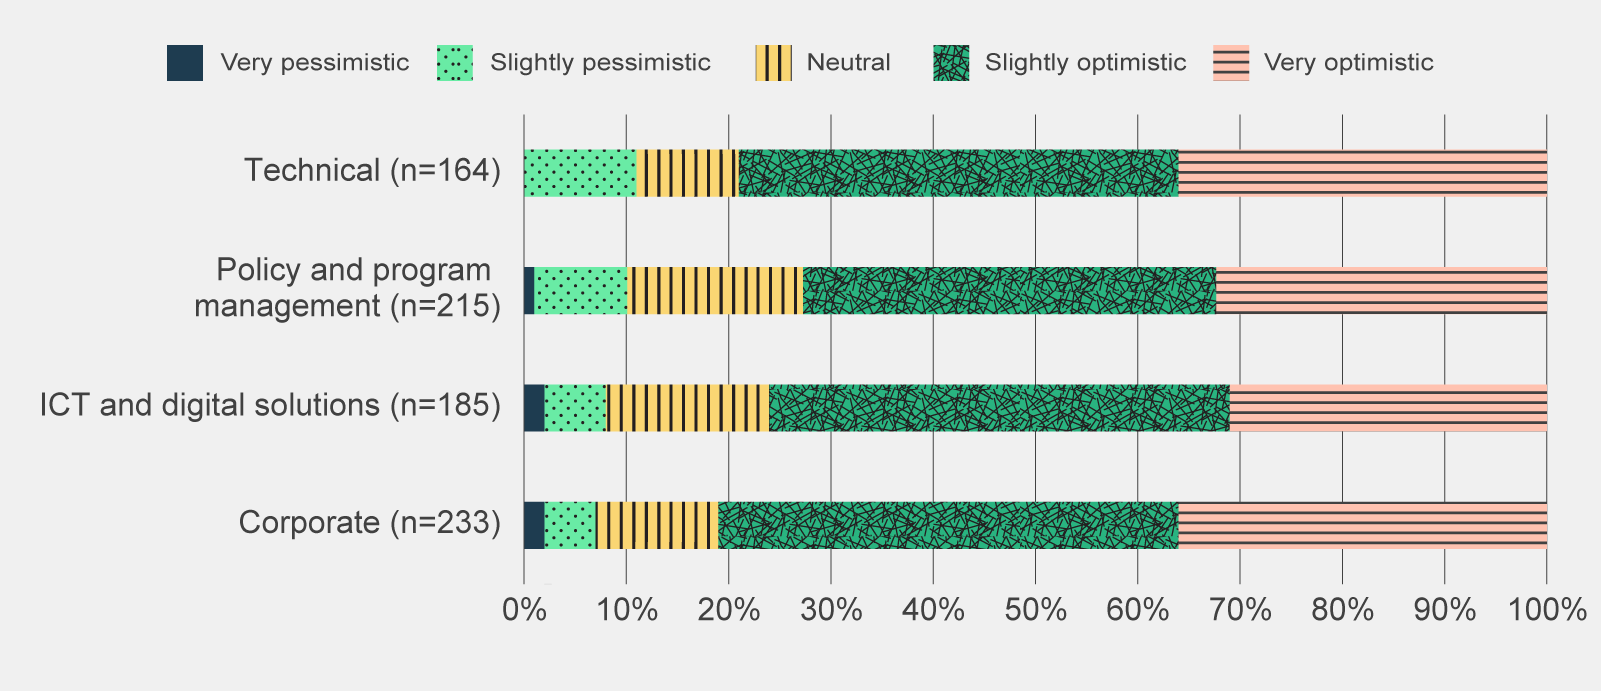
Figure 5 | Post-use survey responses to 'Which of the following best describes your sentiment about Copilot after having used it?', by APS job family -
Data table for figure 5
Post-use survey responses to 'Which of the following best describes your sentiment about Copilot after having used it?', by APS job family.
Sentiment Very pessimistic Slightly pessimistic Neutral Slightly optimistic Very optimistic Technical (n=164) 0% 11% 10% 43%* 36%* Policy and program management (n=215) 1% 9% 17% 40%* 32%* ICT and digital solutions (n=185) 2% 6% 16% 45%* 31%* Corporate (n=233) 2% 5% 12% 45% 36% *Margin of error at a 95% confidence level > 0.05 for combined ‘slightly’ and ‘very optimistic’. Totals may amount to less or more than 100% due to rounding.
Off -
-
-
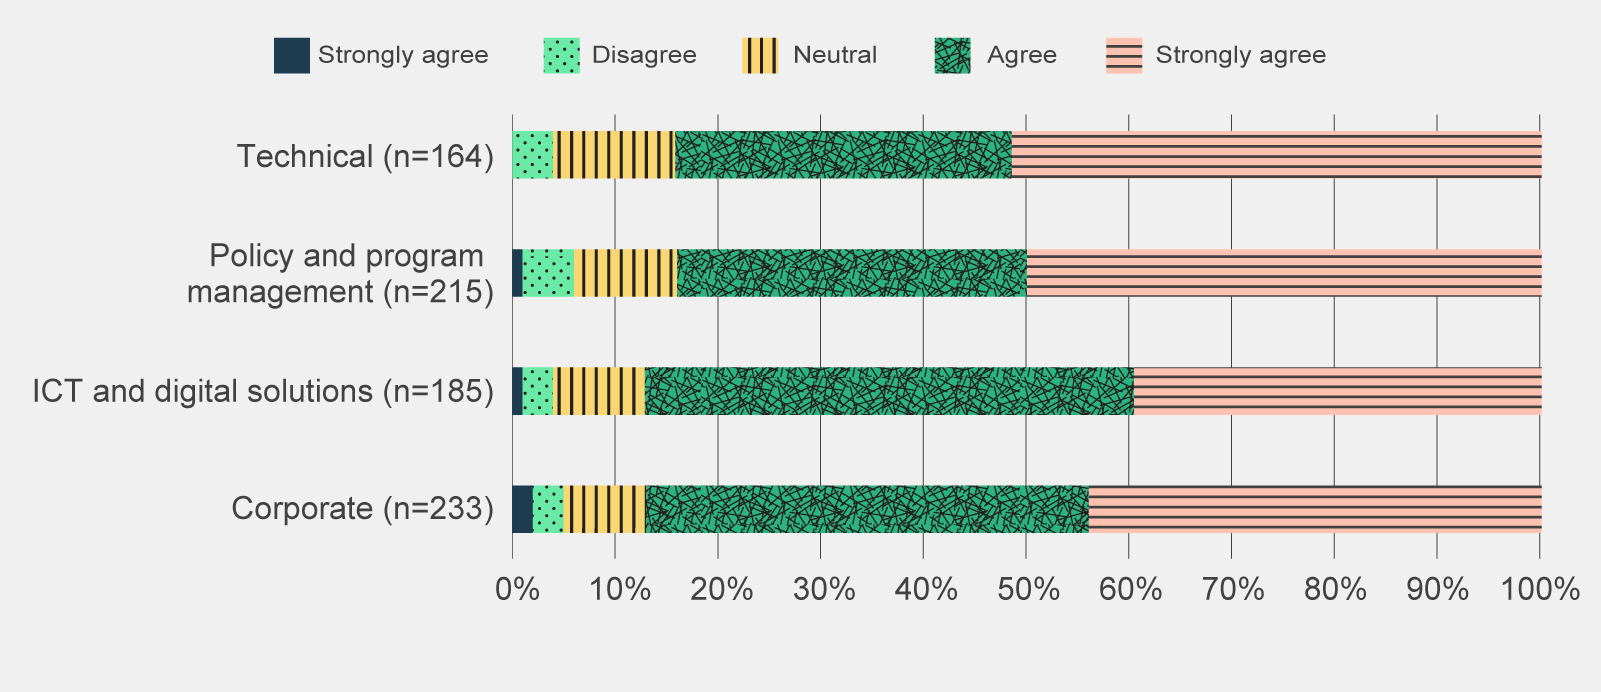
Figure 6 | Post-use survey responses to 'What extent do you agree with the following statement: I want to continue to use Copilot after the trial', by APS job family -
Data table for figure 6
Post-use survey responses to 'What extent do you agree with the following statement: I want to continue to use Copilot after the trial', by APS job family.
Sentiment Strongly disagree Disagree Neutral Agree Strongly agree Technical (n=164) 0% 4% 12% 33% 52% Policy and program management (n=215) 1% 5% 10% 34% 50% ICT and digital solutions (n=185) 1% 3% 9% 48% 40% Corporate (n=233) 2% 3% 8% 43% 44% Totals may amount to less or more than 100% due to rounding.
Off -
-
-
Data table for figure 7
Pulse survey responses to 'How little or how much do you agree with the following statement: Copilot has met my expectations', by Microsoft product (n=1,141).
Sentiment Disagree Somewhat disagree Neutral Somewhat agree Agree Teams 2% 5% 21% 38% 34% Word 4% 7% 19% 42% 28% Outlook 9% 8% 39% 31% 13% Powerpoint 6% 11% 48% 24% 11% Excel 14% 14% 55% 11% 5% Totals may amount to less or more than 100% due to rounding.
Off -
-
-
Many focus group participants and post-use survey respondents found it difficult to prepare data in Excel for effective prompting, in particular the need for data to be structured in tables. In addition, focus group participants noted that Copilot often either could not complete the requested action or would not fully perform the function it was asked (for example only returning the suggested formula for users to enter rather than automatically performing the analysis).
There were also issues with accessing Copilot functionality in MS Outlook. Copilot features in Outlook were only available through either the newest Outlook desktop application or the web version of Copilot. Focus group participants noted that it was unlikely that trial participants had the newest versions of Outlook and were therefore unable to access Copilot features in Outlook. To work around this accessibility barrier, several post-use survey respondents and focus group participants noted they copied content from Outlook into Word or Teams to then prompt Copilot for assistance. The inability to access Copilot in Outlook likely weighed down participant sentiment for this product.
There has been a reduction in positive sentiment across all activities that trial participants had expected Copilot to assist with.
Trial participants who completed both the pre-use and post-use survey recorded a reduction in positive sentiment across most activities Copilot was expected to support. As shown in Figure 8, although the sentiment remains positive for most of these categories, their initial expectations of Copilot were unmet.
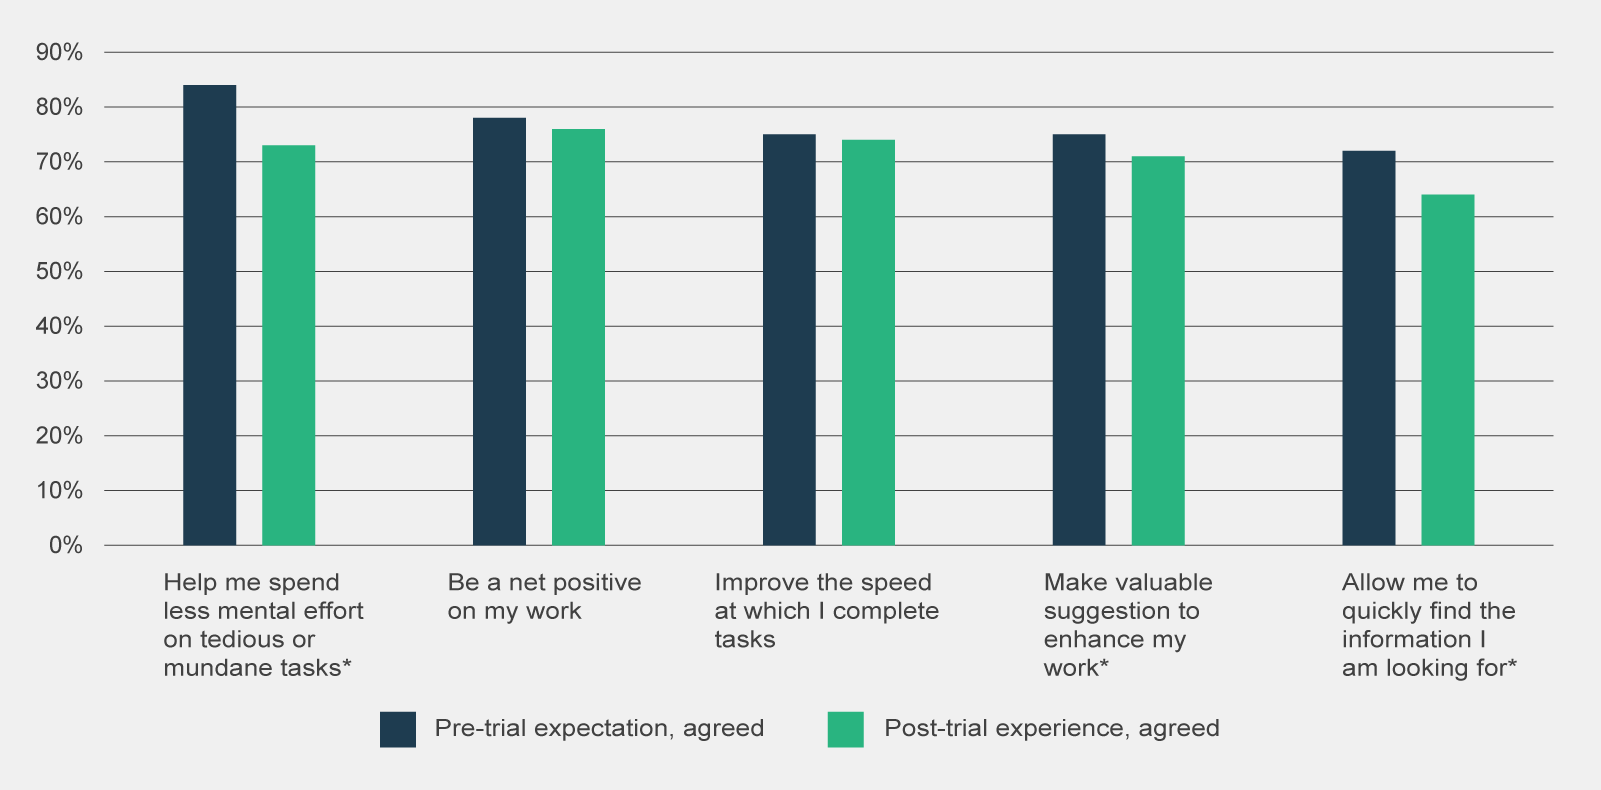
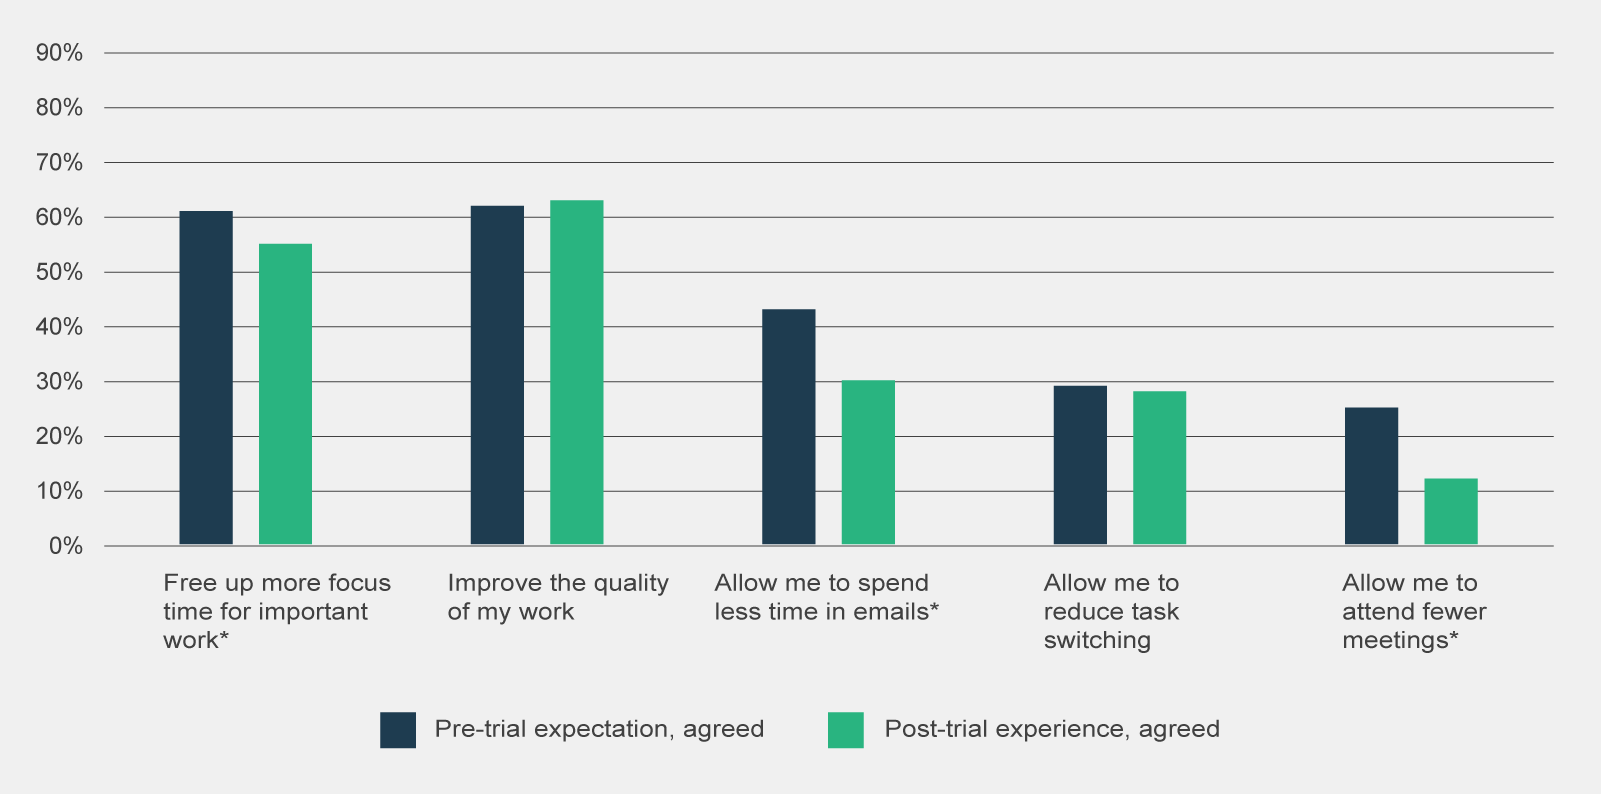
Figure 8 | Comparison of combined 'somewhat agree', 'agree' and 'strongly agree' responses to pre-use survey statement 'I believe Copilot will…' and post-use survey statement 'Using Copilot has…', by type of observation (n=330)
-
Data table for figure 8
Comparison of combined 'somewhat agree', 'agree' and 'strongly agree' responses to pre-use survey statement 'I believe Copilot will…' and post-use survey statement 'Using Copilot has…', by type of observation (n=330).
Sentiment Pre-trial expectation, agreed Post-trial experience, agreed Help me spend less mental effort on tedious or mundane tasks* 84% 73% Be a net positive on my work 78% 76% Improve the speed at which I complete tasks 75% 74% Make valuable suggestion to enhance my work* 75% 71% Allow me to quickly find the information I am looking for* 72% 64% Free up more focus time for important work* 61% 55% Improve the quality of my work 62% 63% Allow me to spend less time in emails* 43% 30% Allow me to reduce task switching 29% 28% Allow me to attend fewer meetings* 25% 12% *Statistically significant change (p-value < 0.05)
Off -
-
-
It is likely that trial participants expectations were heightened prior to the commencement of the trial. During consultations, it was noted that the features of Copilot (and generative AI more broadly) were marketed as being able to significantly save participants’ time, thereby heightening participants expectations. These expectations appear to have been tempered following Copilot’s use.
Of note, the most significant reductions in positive sentiment were observed in activities where survey respondents had the lowest expectations. There was a 32% decrease in the positive belief that Copilot allowed participants to ‘spend less time in emails’ and a 54% reduction in the belief that it would allow them to ‘attend fewer meetings.’ Even with low expectations, survey respondents did not perceive Copilot was able to assist in these activities.
Other generative AI tools may be more effective at meeting bespoke users’ needs than Copilot
The small proportion of trial participants who use other generative AI products in a work capacity found those tools met their needs slightly better than Copilot.
Of the post-use survey respondents, 16% reported that they use other generative AI products to support their role. Post-use survey respondents reported using the following tools:
- Versatile LLMs – ChatGPT, Gemini, Claude, Amazon Q, Meta AI
- Development tools – Github Copilot, Azure
- Image generators/editors – Midjourney, Dall-E 2, Adobe, Canva
As shown in Table 2, 44% of post-use respondents who used other generative AI tools viewed that other tools met their needs more than Copilot.
Table 2. Post-use survey responses to 'How does Microsoft 365 Copilot compare to other generative AI products you have used?' Sentiment Response (%) Other generative AI products meet my needs significantly more than Copilot 13% Other generative AI products meet my needs slightly more than Copilot 31% Copilot and other generative AI products meet my needs to the same extent 32% Copilot meets my needs slightly more than other generative AI products 13% Copilot meets my needs significantly more than other generative AI products 11% Copilot offers general functionality, matching most features of other publicly available generative AI products, but it may not offer an equivalent level of sophistication or depth across all these features. Post-use survey respondents noted that generative AI products were used for discrete use cases where Copilot was considered less advanced such as: writing and reviewing code, producing more complex written documents, generating images for internal presentations and searching research databases.
Despite the positive sentiment, the actual use of Copilot is moderate
A third of post-use survey respondents used Copilot daily.
While survey respondents were generally positive towards Copilot, the majority of survey respondents did not frequently use Copilot. As shown in Table 3, only a third of post-use survey respondents used Copilot on a daily basis.
Table 3. Post-use survey responses to 'How frequently did you use Copilot for Microsoft 365 during the trial?' (n=811) How frequently did you use Copilot for Microsoft 365 during the trial? Responses (%) Not at all 1% A few times a month 21% A few times a week 46% A few times a day 26% Most of the day 6% The moderate frequency of usage was broadly consistent across APS classifications and job families. There was variance, however, across cohorts relating to the features used. For example, a higher proportion of SES and EL2s used the Teams meeting summarisation compared to other APS classifications. This could reflect the higher number of meetings these cohorts needed to attend, and therefore the higher usage and potential benefits in meeting summaries for the SES and EL2 classifications.
Post-use survey respondents who only used Copilot a few times a month highlighted that they stopped using Copilot because they had a poor first experience with the tool or that it took more time to verify and edit outputs than it would take to create them otherwise. Similarly, other post-use survey respondents remarked they did not feel confident using the tool and couldn’t find time for training among other work commitments and time pressures.
Focus groups with trial participants also remarked that they often forgot Copilot was embedded into Microsoft 365 applications as it was not obviously apparent in the user interface. Consequently they neglected to use features, including forgetting to record meetings for transcription and summarisation. Commonwealth Scientific and Industrial Research Organisation (CSIRO) identified through internal research with CSIRO trial participants that the user interface at times made it difficult to find features (CSIRO 2024:28). Given one of the arguable advantages of Copilot is its current integration with existing MS workflows, its reported lack of visibility amongst users largely diminishes its greatest value-add.
Overall, the usage of Copilot is in its infancy within the APS. Due to a combination of user capability, user interface, perceived benefit of the tool and convenience, Copilot is yet to be ingrained in the daily habits of APS staff.
Copilot was predominantly used to summarise and re-write content
Copilot use is concentrated in MS Teams and Word.
While Copilot provides support in a range of activities, the use of Copilot amongst trial participants was concentrated in a few activities. As shown in Figure 9, over 70% of post-use survey respondents used Copilot in Teams to summarise meetings, and in Word to summarise documents or to re-write content.


Figure 9 | Post-use survey responses, grouped by Microsoft application, to 'How frequently did you use the following features?' of ‘a few times a month’ or more frequent
-
Data table for figure 9
Post-use survey responses, grouped by Microsoft application, to 'How frequently did you use the following features?' of ‘a few times a month’ or more frequent.
OffFeature Used at least once Microsoft application General queries 58% Copilot chat Interface with other Microsoft products 49% Copilot chat Document search/retrieval 46% Copilot chat Data analysis 20% Excel Formula assistance 19% Excel Insight generation 16% Excel Summarisation 3% Loop Draft page content 3% Loop Content editing 2% Loop Idea generation 2% Loop Summarisation 9% OneNote Content generation 6% OneNote Task management 6% OneNote Collaboration enhancement 3% OneNote Drafting assistance 43% Outlook Email summarisation 41% Outlook Meeting follow-up 23% Outlook Content creation 33% PowerPoint Design suggestions 29% PowerPoint Summarisation 26% PowerPoint Meeting summaries 72% Teams Real-time answers 54% Teams Task management 39% Teams Content summarisation 3% Whiteboard Content organisation 2% Whiteboard Idea generation 2% Whiteboard Interactive collaboration 2% Whiteboard Summarisation 71% Word Rewrite suggestions 71% Word Tone adjustments 52% Word Formatting assistance 47% Word
Connect with the digital community
Share, build or learn digital experience and skills with training and events, and collaborate with peers across government.

